
Arcade company Dave & Buster’s (NASDAQ:PLAY) fell short of the market’s revenue expectations in Q3 CY2024, with sales falling 3% year on year to $453 million. Its non-GAAP loss of $0.45 per share was 23.8% below analysts’ consensus estimates.
Is now the time to buy Dave & Buster's? Find out by accessing our full research report, it’s free.
Dave & Buster's (PLAY) Q3 CY2024 Highlights:
- Revenue: $453 million vs analyst estimates of $463.7 million (3% year-on-year decline, 2.3% miss)
- Adjusted EPS: -$0.45 vs analyst expectations of -$0.36 (23.8% miss)
- Adjusted EBITDA: $68.3 million vs analyst estimates of $72.99 million (15.1% margin, 6.4% miss)
- Operating Margin: 1.4%, down from 4% in the same quarter last year
- Same-Store Sales fell 7.7% year on year (-3.7% in the same quarter last year)
- Market Capitalization: $1.39 billion
“On behalf of our whole Board, I would like to thank Chris for the effort he put into this great company over the past two and a half years and wish him well in his future endeavors,” said Kevin Sheehan, Chair of the Board and interim CEO of Dave & Buster’s.
Company Overview
Founded by a former game parlor and bar operator, Dave & Buster’s (NASDAQ:PLAY) operates a chain of arcades providing immersive entertainment experiences.
Leisure Facilities
Leisure facilities companies often sell experiences rather than tangible products, and in the last decade-plus, consumers have slowly shifted their spending from "things" to "experiences". Leisure facilities seek to benefit but must innovate to do so because of the industry's high competition and capital intensity.
Sales Growth
A company’s long-term performance is an indicator of its overall quality. While any business can experience short-term success, top-performing ones enjoy sustained growth for years. Over the last five years, Dave & Buster's grew its sales at a 10.4% compounded annual growth rate. Although this growth is solid on an absolute basis, it fell short of our benchmark for the consumer discretionary sector.
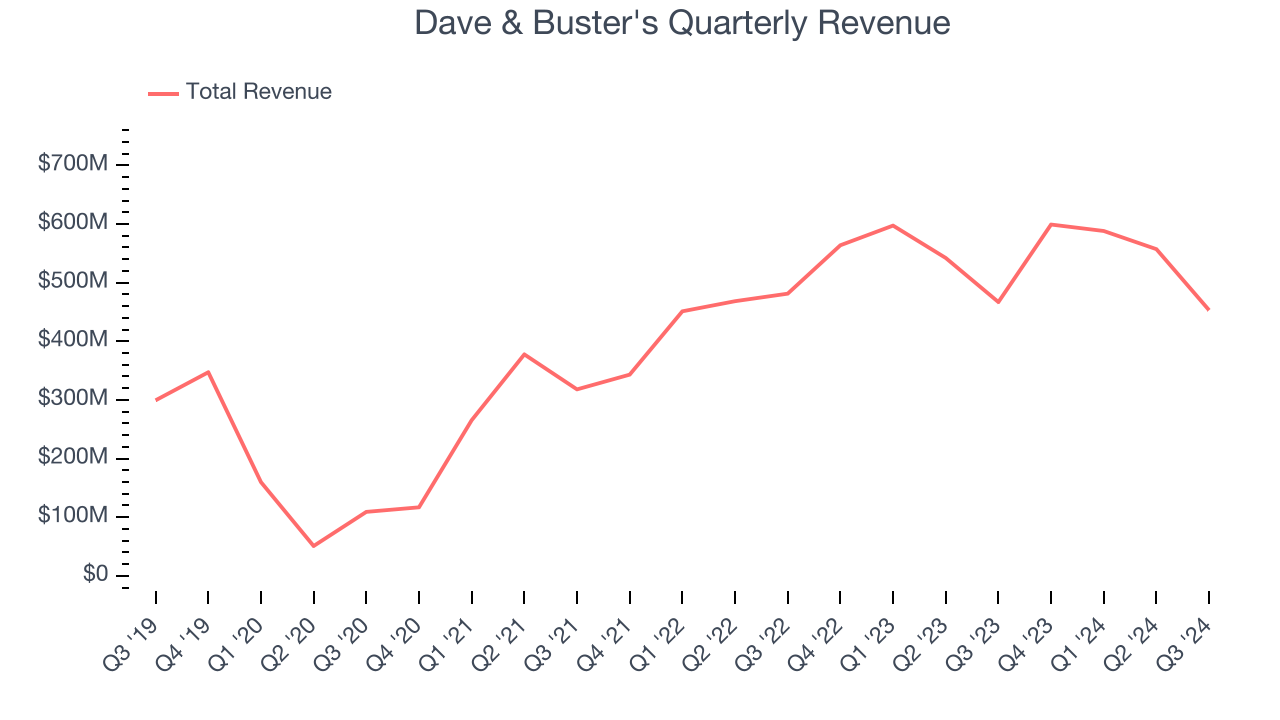
Long-term growth is the most important, but within consumer discretionary, product cycles are short and revenue can be hit-driven due to rapidly changing trends and consumer preferences. Dave & Buster’s annualized revenue growth of 12.3% over the last two years is above its five-year trend, but we were still disappointed by the results. Note that COVID hurt Dave & Buster’s business in 2020 and part of 2021, and it bounced back in a big way thereafter. 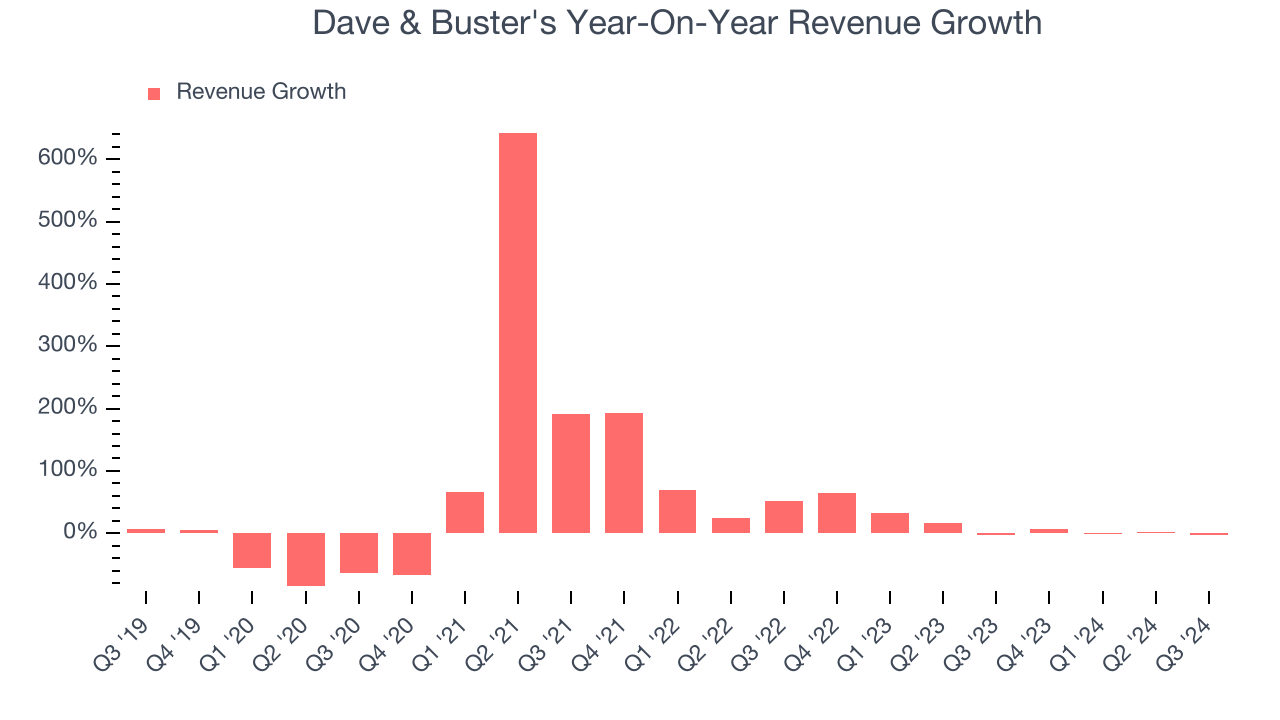
Dave & Buster's also reports same-store sales, which show how much revenue its established locations generate. Over the last two years, Dave & Buster’s same-store sales were flat. Because this number is lower than its revenue growth, we can see the opening of new locations is boosting the company’s top-line performance. 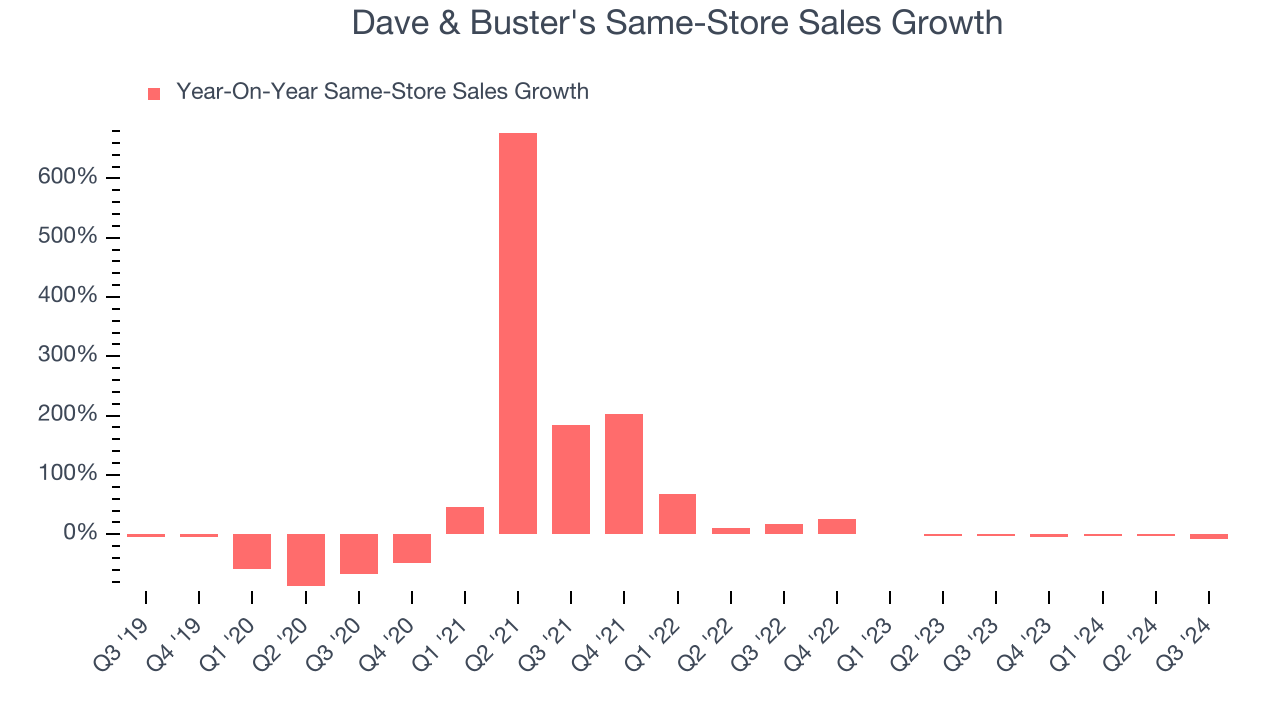
This quarter, Dave & Buster's missed Wall Street’s estimates and reported a rather uninspiring 3% year-on-year revenue decline, generating $453 million of revenue.
Looking ahead, sell-side analysts expect revenue to grow 3.4% over the next 12 months, a deceleration versus the last two years. This projection doesn't excite us and implies its products and services will see some demand headwinds.
Here at StockStory, we certainly understand the potential of thematic investing. Diverse winners from Microsoft (MSFT) to Alphabet (GOOG), Coca-Cola (KO) to Monster Beverage (MNST) could all have been identified as promising growth stories with a megatrend driving the growth. So, in that spirit, we’ve identified a relatively under-the-radar profitable growth stock benefiting from the rise of AI, available to you FREE via this link.
Cash Is King
If you’ve followed StockStory for a while, you know we emphasize free cash flow. Why, you ask? We believe that in the end, cash is king, and you can’t use accounting profits to pay the bills.
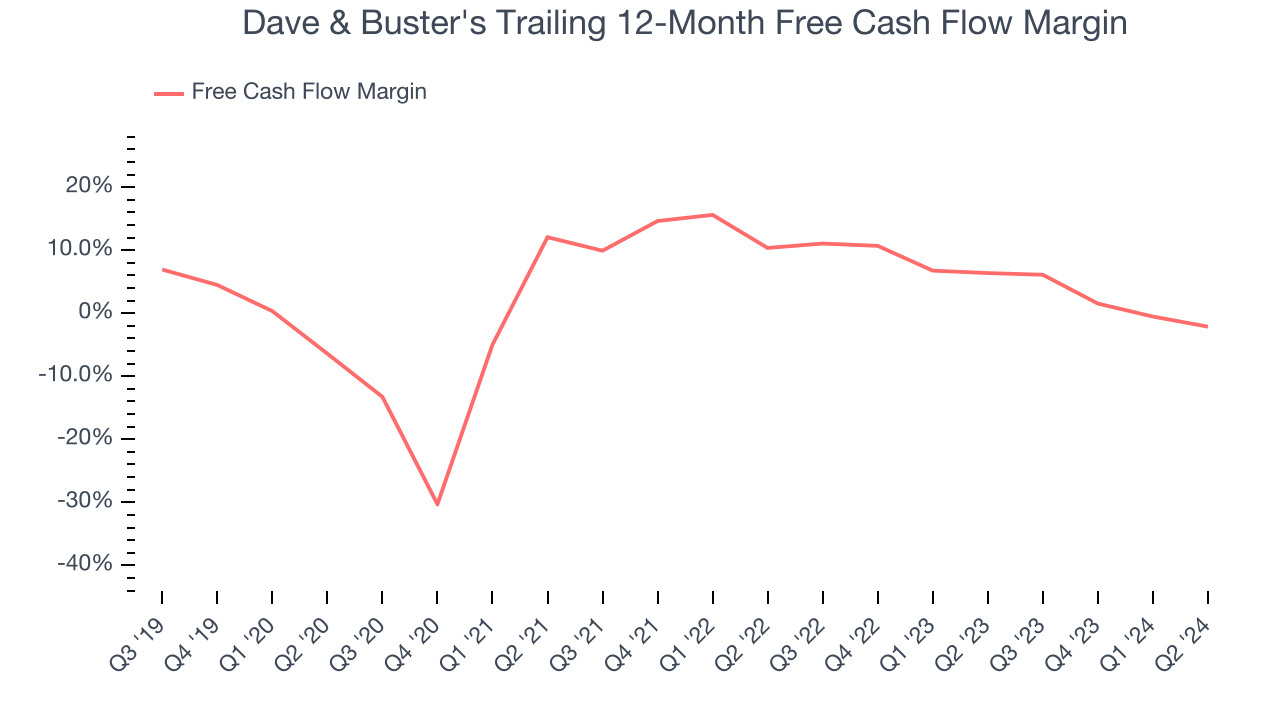
Dave & Buster's has shown poor cash profitability over the last two years, giving the company limited opportunities to return capital to shareholders. Its free cash flow margin averaged 2.3%, lousy for a consumer discretionary business.
Key Takeaways from Dave & Buster’s Q3 Results
We struggled to find many resounding positives in these results as the company missed analysts' estimates across all key metrics, including revenue, same-store sales, EPS, and EBITDA. Overall, this was a softer quarter. The stock traded down 5.5% to $34.80 immediately following the results.
Dave & Buster's didn’t show it’s best hand this quarter, but does that create an opportunity to buy the stock right now? When making that decision, it’s important to consider its valuation, business qualities, as well as what has happened in the latest quarter. We cover that in our actionable full research report which you can read here, it’s free.

