

As the dominant eCommerce giant, Alibaba Group Holding Ltd. (NYSE: BABA) is often considered the Amazon.com Inc. (NASDAQ: AMZN) of China. By sales, it's the third largest eCommerce giant in the world. With shares trading up just 3.6% year-to-date (YTD), it is also considerably underperforming the Nasdaq-100 index, up 20.8% YTD. With shares trading down nearly 75% from their all-time highs, this computer and technology sector leader stock has plenty of room to rebound. Here are five reasons why Alibaba stock may be a steal at these valuations.
Alibaba’s Parts May Still Be Worth More Than the Whole
In 2023, Alibaba announced that it would split the business into six separate entities to enhance shareholder value. Several of its entities would be standalone publicly traded companies, and shareholders would get a piece of the new companies. This initially sent shares to $105.05 on March 27, 2023. However, Alibaba had to walk back many of those plans.
In November, the company squashed its plans to spin off its cloud divisions due to uncertainties regarding U.S. chip export restrictions. Instead, the company would focus on growing its Cloud Intelligence Group, which is comprised of its artificial intelligence (AI) units and Alibaba Cloud in-house. It also scrapped plans to spin off Cainiao, its logistics business. IPOs Freshippo, Sun Art, InTime, and Dingtalk are all delayed. In fact, the creator of the spinoff Blueprint, chairman and CEO Daniel Zhang, has left Alibaba. The parts still make up the whole. This leaves the potential for future spinoffs under the current CEO and Co-founder Eddie Wu.
Alibaba is Still a Profitable Cash Flow Machine
Alibaba reported Q2 EPS of $1.40, missing consensus estimates by 2 cents. Revenues rose 3.66% YoY to $30.67 billion, beating consensus estimates by $256.7 million. The company generated non-GAAP net income of $3.382 billion. Alibaba generated $3.23 billion in net cash from operating activities and a free cash flow of $2.12 billion. Its current cash ratio is 44%, indicating a 2 to 3x undervaluation.
BABA stock trades at an 18.57 price-earnings (PE), with a market capitalization of $202.11 billion. Its forward PE is just 11.44. Price-sales are 1.55, and price-book is 1.32. The stock also provides a 1.32% annual dividend yield. According to MarketBeat’s consensus price target of $108.79, there is a 36.58% upside in the shares. Of 16 analyst ratings, 13 rate the stock a Buy, and three rate it a Hold. Alibaba's 10-year historic PE is around 31.
Alibaba Continues at the Forefront of China’s AI Revolution
Alibaba is at the forefront of the AI revolution in China. Its large language model (LLM) Qwen2.5, powered by the Tongyi Qianwen model, was unveiled after 90,000 deployments to meet the rising demand for generative AI (GenAI). It's an upgrade to its previous Qwen2.0. The upgraded model made notable advancements in code comprehension, reasoning, and textual understanding.
Over 2.2 million corporate users can access Alibaba's Qwen-powered AI service from DingTalk, its collaboration platform. Alibaba is also integrating AI tools to better assist foreign merchants with content creation, translation, and product returns in its AliExpress and Lazada online marketplaces. These marketplaces accommodate over 300 million consumers and 1 million global merchants annually under the Alibaba International Digital Commerce Group.
BABA Stock is Forming a Symmetrical Triangle
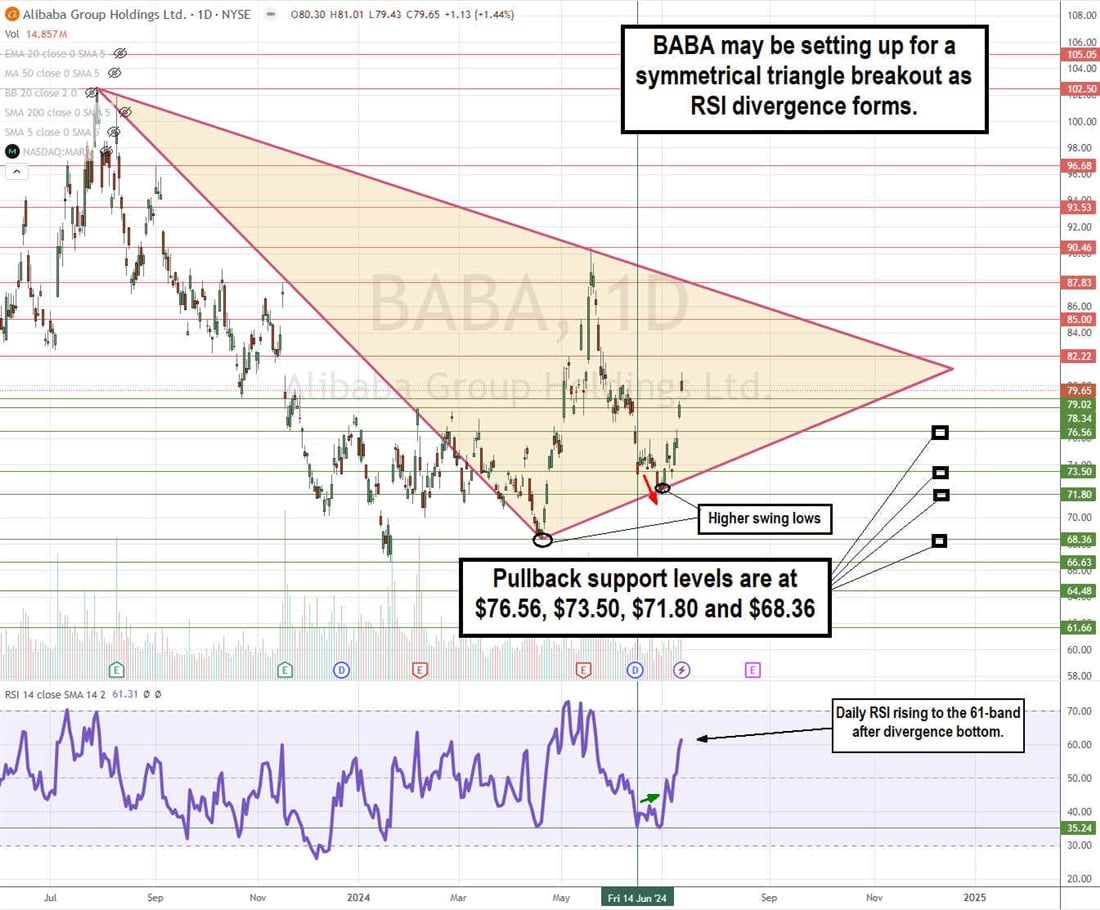
The daily candlestick chart on BABA illustrates the higher swing lows being made on deep pullbacks, forming a symmetrical triangle. Its first recent swing low was $66.63 on January 22, 2024. Shares bounced to a $78.24 peak before pulling back to a higher swing low of $68.36 on April 19, 2024. BABA shares shot up to a high of $90.46 on May 17, 2024, before pulling back to a higher low of $71.80. The descending trendline formed at $102.50 on July 31, 2024, and formed a lower swing high at $90.46 on May 14, 2024. The daily relative strength index (RSI) also formed a divergence bottom and is now climbing to the 61-band. Pullback support levels are rising at $76.56, $73.50, $71.80 and $68.36.
