The Trend Asset Allocation Model is an asset allocation model that applies trend-following principles based on the inputs of global stock and commodity prices. This model has a shorter time horizon and tends to turn over about 4-6 times a year. The performance and full details of a model portfolio based on the out-of-sample signals of the Trend Model can be found here.

My inner trader uses a trading model, which is a blend of price momentum (is the Trend Model becoming more bullish, or bearish?) and overbought/oversold extremes (don't buy if the trend is overbought, and vice versa). Subscribers receive real-time alerts of model changes, and a hypothetical trading record of the email alerts is updated weekly here. The hypothetical trading record of the trading model of the real-time alerts that began in March 2016 is shown below.

The latest signals of each model are as follows:
- Ultimate market timing model: Sell equities*
- Trend Model signal: Neutral*
- Trading model: Bearish*
Update schedule: I generally update model readings on my site on weekends. I am also on Twitter at @humblestudent and on Mastodon at @humblestudent@toot.community. Subscribers receive real-time alerts of trading model changes, and a hypothetical trading record of those email alerts is shown here.
Subscribers can access the latest signal in real-time here.
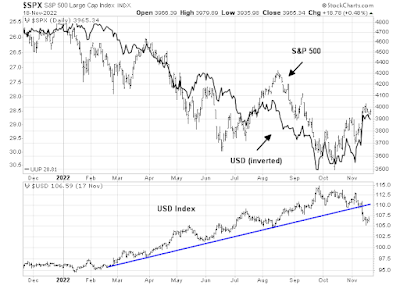
A risk-on stampede?I pointed out in the past that risk appetite in 2022 can largely be attributable to changes in the USD. The S&P 500 has shown a close inverse correlation to the greenback. Now that the USD has decisively violated trend line support, does that mean that it's time for investors to stampede into a risk-on trade?

What are the fundamentals that explain the technical breakdown in the USD? Has the Fed signaled that it is about to out-dove the European Central Bank and other major central banks, which would narrow interest rate differentials and weaken the dollar? Will other central banks out-hawk the Fed?
The full post can be found here.

