
Reminder: David is available to chat with Members, comments are found below each post.
| |||||||
…
Mid-Day UpdateJanuary 05, 2012 at 13:58 PM EST
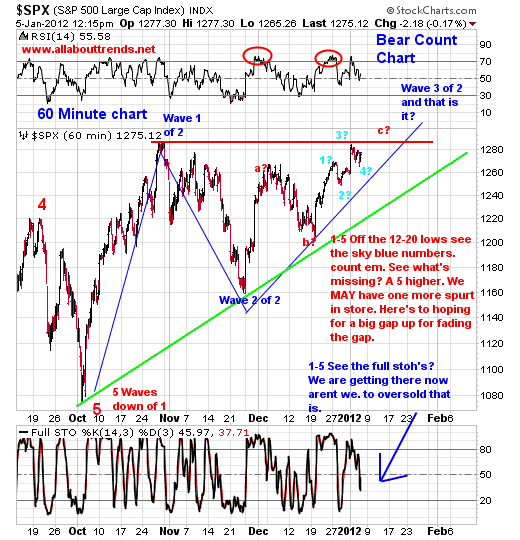
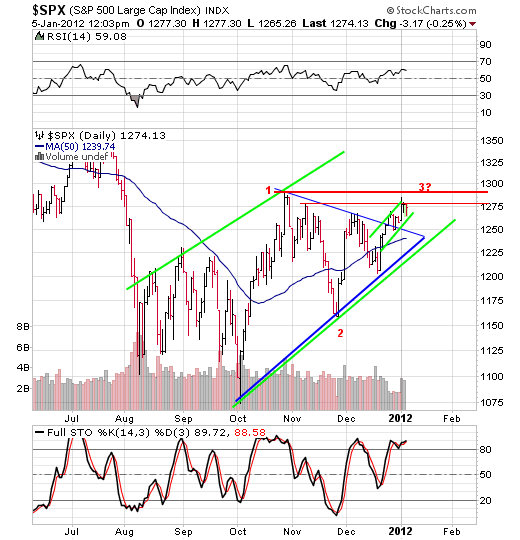
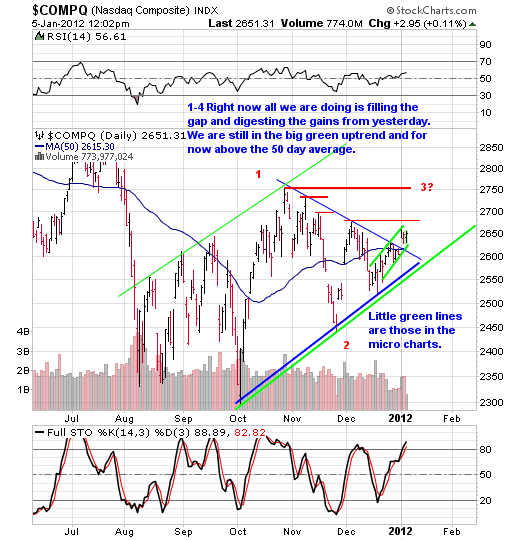
Reminder: David is available to chat with Members, comments are found below each post. If I had to sum up the markets here I could do so in three words: Backing And Filling Remember how we’ve talked numerous times about how markets digest gains? sideways or down in corrective fashion vs impulsive action and that is what we go the last two days from the gap up on Tuesday. Of course over the last hour its now trying to work its way higher which is fine by me. That corrective not really giving up the ghost is exactly why we havent taken any short sells or go long any inverse ETF’s for the tiime being. Yesterday we said: When I look at the daily charts right now all I’m seeing is a pullback that may fill the gap. In so doing it will reset the Full Stoh’s on the 60 minute charts . Below is the S&P 500 chart in 60 minute time frequency. Below are the daily chart frequencies of the SPX and Comp. 1-5 Notice how both of these indexes never broke the small green channel lines to the downside? This is the short term channel we really want to pay attention to from here on out as it defines the current upswing. OHH, as far as employment getting better the last two months? Well of course it was better, seasonal Christmas hiring- DUH. Not to mention those who fell off the statistics measurements. And what about those who lost jobs BUT were given one year severance packages, they aren’t included in the numbers now are they? Lets see how January and February pan out shall we. "What to watch for" and ‘What to watch out for" Example Chart Of the Day Hat Tip to Warren for this chart . Folks, what we have here is another thing of …
Reminder: David is available to chat with Members, comments are found below each post.
… 
Data & News supplied by www.cloudquote.io
Stock quotes supplied by Barchart Quotes delayed at least 20 minutes. By accessing this page, you agree to the following Privacy Policy and Terms and Conditions. |
| ||||||||