
Reminder: David is available to chat with Members, comments are found below each post.
|
…
Mid-Day UpdateJanuary 04, 2012 at 12:58 PM EST
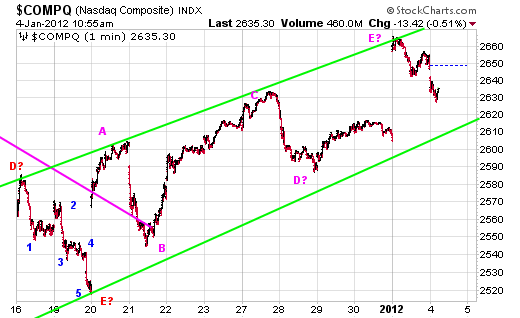
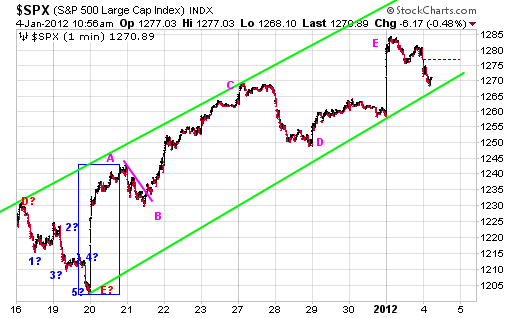
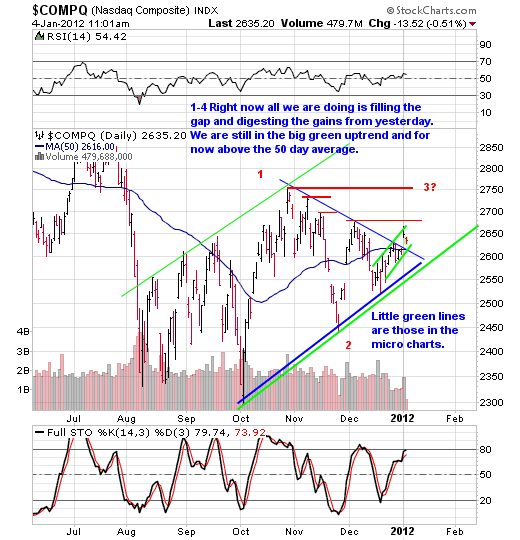
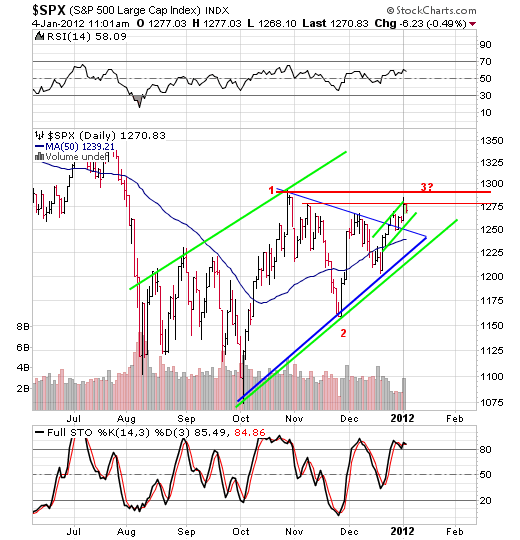
Reminder: David is available to chat with Members, comments are found below each post. Yesterday we said when viewing the micro charts: C an you say TREND CHANNEL RESISTANCE? Same goes for SPX chart in one minute time frequency. When viewing the daily frequency charts from the summary we said: Trend channel resistance and a big gap that at some point is going to have to be filled. Funny how those pops turn into drops huh? So why did we pop on the 20th and never look back? Just look at the NASDAQ and SPX chart below. We were in threat of breaking to the downside of the whole uptrend off the Oct lows all going into Christmas that’s why. We couldn’t have that now could we? Yes Virginia, not only is there a Santa (I think his name is actually Ben, but don’t tell anyone) he is also stronger than the Grinch. Funny how that "Magically" happens now isn’t it. You can also use that to your advantage by the way folks. All you have to do is think like a Central Bankster errr banker (IE The Presidents Group On Working Capital commonly referred to as the PPT or Plunge protection Team).That’s for you conspiracy theory folks out there. BUT in all seriousness ? For the rest of us? That gap was more important than yesterday’s because it took place right where it HAD TO, at a major uptrend support vs yesterday’s AFTER we’ve been moving higher. When I look at the daily charts right now all I’m seeing is a pullback that may fill the gap. In so doing it will reset the Full Stoh’s on the 60 minute charts. A big change in trend comes WHEN we break to the downside of the big picture uptrend off the Oct. lows. That is a big trade and its on the short side. The other big trade is at MAJOR resistance (assuming we get there) which are talked about just below. In Summary: Big picture we are going to be in …
Reminder: David is available to chat with Members, comments are found below each post.
… 
Data & News supplied by www.cloudquote.io
Stock quotes supplied by Barchart Quotes delayed at least 20 minutes. By accessing this page, you agree to the following Privacy Policy and Terms and Conditions. |
|