
Reminder: David is available to chat with Members, comments are found below each post.
|
…
Mid-Day UpdateDecember 29, 2011 at 13:00 PM EST
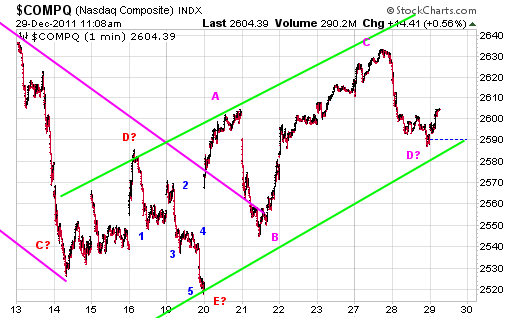
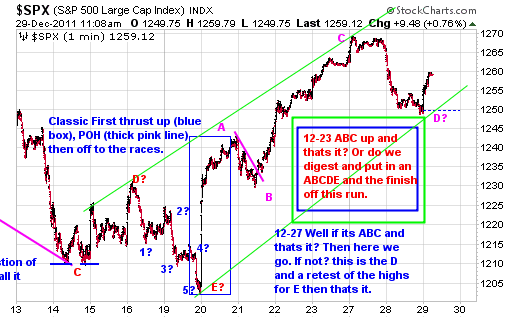
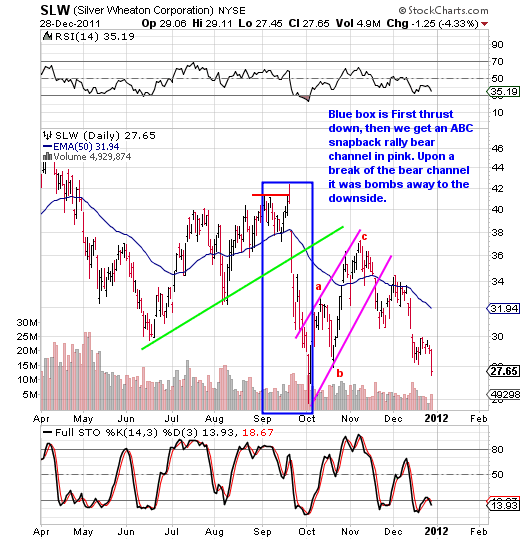
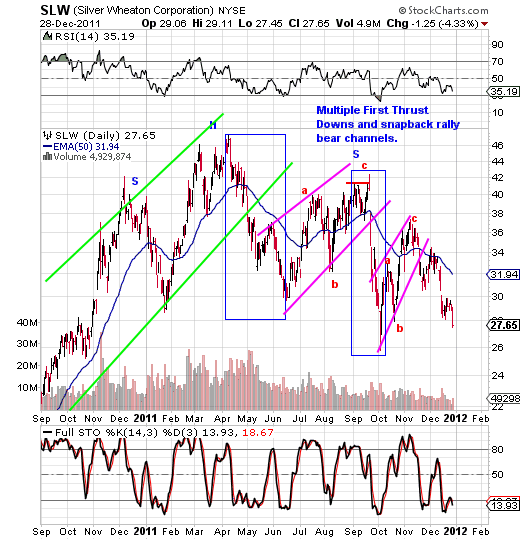
Reminder: David is available to chat with Members, comments are found below each post. 12-29 By popular demand we are going to launch a new model portfolio strictly dedicated to ETFs. It will start with a tracking value of 100,000 and will kick off with the first ETF trades that we trade trigger and will be tracked separately for performance purposes. Stay tuned for further developments. Yesterday we said: All we need to know for now can be found in the short term micro charts that cover everything from the December lows (December highs in the inverse ETFs) The big question is? Can we actually make to a retest of the recent highs (c)? If so odds favor it’s a gap up pump ‘em up move. A break of the green line says something else and MAY say that was it to the upside. Keep in mind we are in holiday trade and that tends to skew things a bit so take it all with a grain of salt this week. A retest of the highs and struggling at that level from yesterday with failure and we’ll want to nibble on some shorts and inverse ETFs Short Sell Set Up Pattern Of the Day (What To Watch For) Now let’s look at it again from a longer term time frame. See that big ABC snapback rally from the June 2011 Lows to the late September 2011 highs? First off see the mini shake and bake breakout that FAILED? We talk about not buying breakouts around here all the time and that’s another example why. The other thing we want you to observe is the BIG HEAD AND SHOULDERS TOP with that whole ABC snapback rally being the right shoulder. See how far down that break went? From the top of the right shoulder or the shake and bake high it went from 41 to 26 in short order no pun intended! That is why we are willing to nibble on the inverse …
Reminder: David is available to chat with Members, comments are found below each post.
… 
Data & News supplied by www.cloudquote.io
Stock quotes supplied by Barchart Quotes delayed at least 20 minutes. By accessing this page, you agree to the following Privacy Policy and Terms and Conditions. |
|