

RV Manufacturer Winnebago (NYSE: WGO) reported revenue ahead of Wall Street’s expectations in Q1 CY2025, but sales fell by 11.9% year on year to $620.2 million. On the other hand, the company’s full-year revenue guidance of $2.9 billion at the midpoint came in 1.6% below analysts’ estimates. Its non-GAAP profit of $0.19 per share was 19.2% above analysts’ consensus estimates.
Is now the time to buy Winnebago? Find out by accessing our full research report, it’s free.
Winnebago (WGO) Q1 CY2025 Highlights:
- Revenue: $620.2 million vs analyst estimates of $616.7 million (11.9% year-on-year decline, 0.6% beat)
- Adjusted EPS: $0.19 vs analyst estimates of $0.16 (19.2% beat)
- Adjusted EBITDA: $22.8 million vs analyst estimates of $22.38 million (3.7% margin, 1.9% beat)
- The company dropped its revenue guidance for the full year to $2.9 billion at the midpoint from $3.05 billion, a 4.9% decrease
- Management lowered its full-year Adjusted EPS guidance to $3.25 at the midpoint, a 13.3% decrease
- Operating Margin: 1.3%, down from 5% in the same quarter last year
- Free Cash Flow was -$18.9 million, down from $14.2 million in the same quarter last year
- Market Capitalization: $987.1 million
“Winnebago Industries continues to demonstrate solid performance in our strategic markets, leveraging product differentiation and sharper affordability options to maintain healthy market share in our core premium and mid-range RV segments,” said President and Chief Executive Officer Michael Happe.
Company Overview
Created to provide high-quality, affordable RVs to the post-war American family, Winnebago (NYSE: WGO) is a manufacturer of recreational vehicles, providing a range of motorhomes, travel trailers, and fifth-wheel products for outdoor and adventure lifestyles.
Automobile Manufacturing
Much capital investment and technical know-how are needed to manufacture functional, safe, and aesthetically pleasing automobiles for the mass market. Barriers to entry are therefore high, and auto manufacturers with economies of scale can boast strong economic moats. However, this doesn’t insulate them from new entrants, as electric vehicles (EVs) have entered the market and are upending it. This has forced established manufacturers to not only contend with emerging EV-first competitors but also decide how much they want to invest in these disruptive technologies, which will likely cannibalize their legacy offerings.
Sales Growth
A company’s long-term performance is an indicator of its overall quality. Any business can have short-term success, but a top-tier one grows for years. Unfortunately, Winnebago’s 3.9% annualized revenue growth over the last five years was sluggish. This fell short of our benchmark for the industrials sector and is a tough starting point for our analysis.
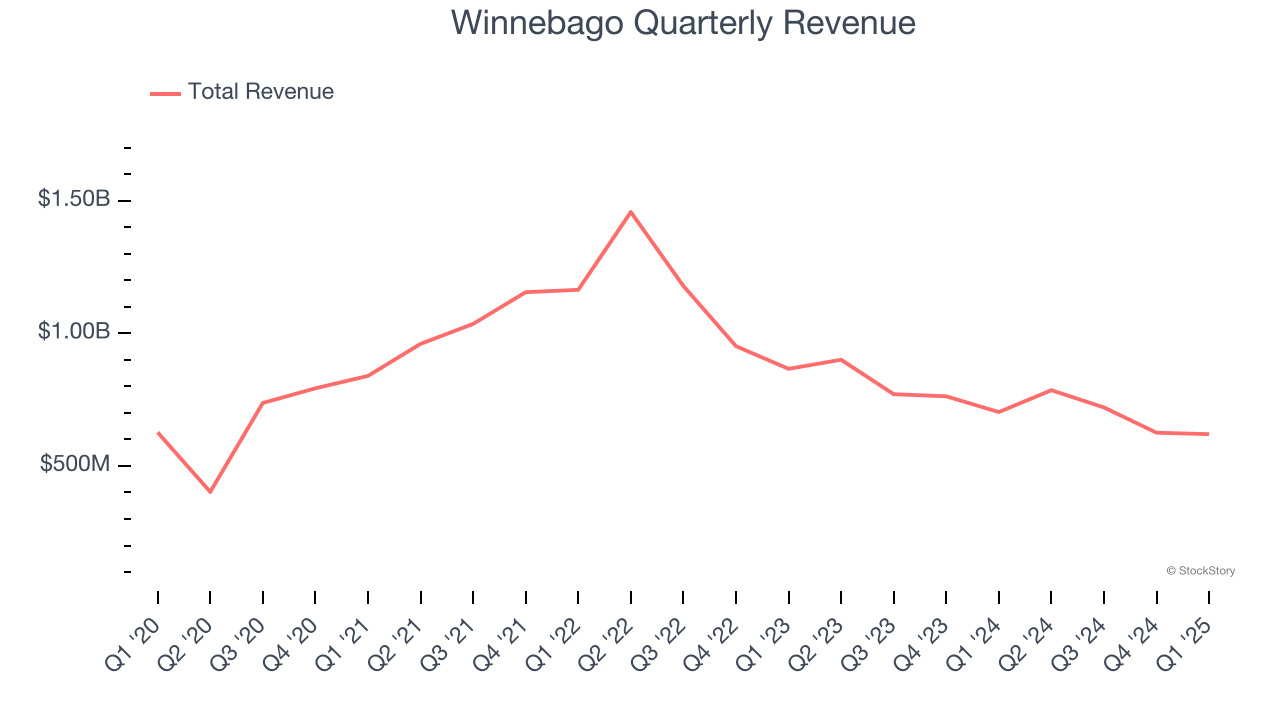
We at StockStory place the most emphasis on long-term growth, but within industrials, a half-decade historical view may miss cycles, industry trends, or a company capitalizing on catalysts such as a new contract win or a successful product line. Winnebago’s performance shows it grew in the past but relinquished its gains over the last two years, as its revenue fell by 21.4% annually. Winnebago isn’t alone in its struggles as the Automobile Manufacturing industry experienced a cyclical downturn, with many similar businesses observing lower sales at this time. 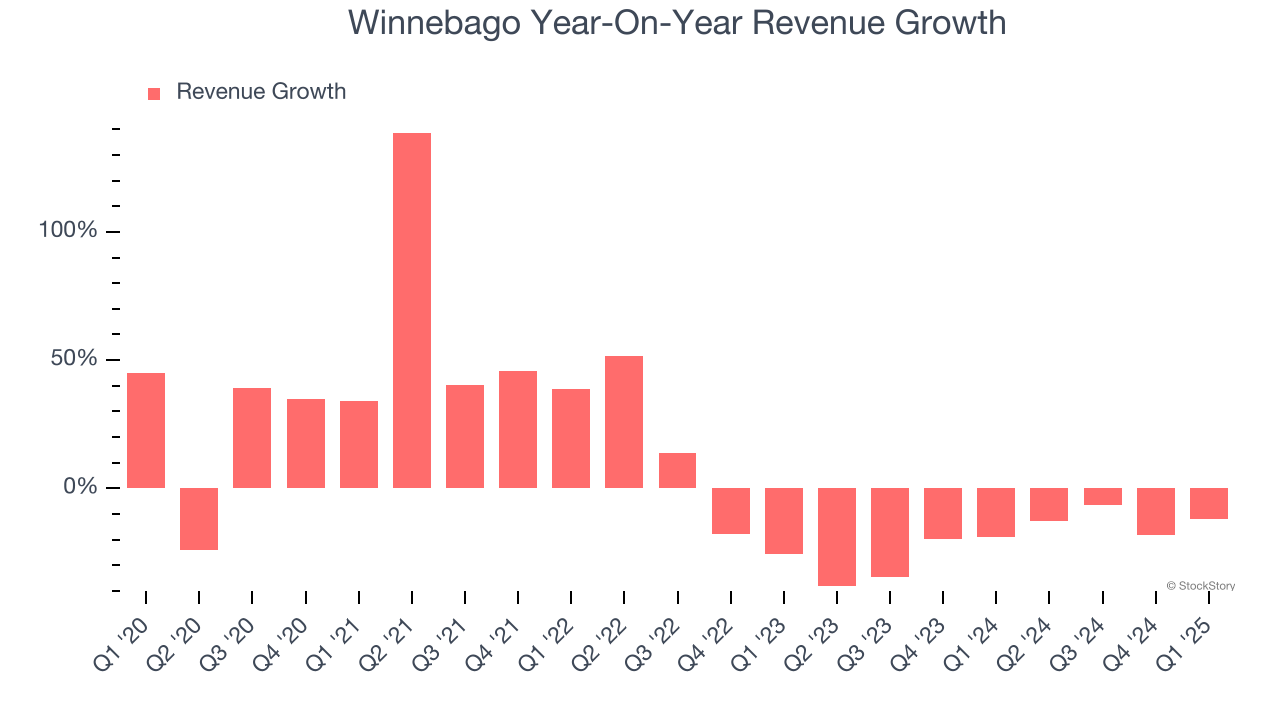
We can dig further into the company’s revenue dynamics by analyzing its most important segments, Motorhomes and Towables, which are 38% and 46.5% of revenue. Over the last two years, Winnebago’s Motorhomes revenue (homes on wheels) averaged 23.4% year-on-year declines while its Towables revenue (non-motorized vehicles) averaged 16.7% declines.
This quarter, Winnebago’s revenue fell by 11.9% year on year to $620.2 million but beat Wall Street’s estimates by 0.6%.
Looking ahead, sell-side analysts expect revenue to grow 12.6% over the next 12 months, an improvement versus the last two years. This projection is admirable and indicates its newer products and services will fuel better top-line performance.
Today’s young investors won’t have read the timeless lessons in Gorilla Game: Picking Winners In High Technology because it was written more than 20 years ago when Microsoft and Apple were first establishing their supremacy. But if we apply the same principles, then enterprise software stocks leveraging their own generative AI capabilities may well be the Gorillas of the future. So, in that spirit, we are excited to present our Special Free Report on a profitable, fast-growing enterprise software stock that is already riding the automation wave and looking to catch the generative AI next.
Operating Margin
Winnebago has done a decent job managing its cost base over the last five years. The company has produced an average operating margin of 8.4%, higher than the broader industrials sector.
Analyzing the trend in its profitability, Winnebago’s operating margin decreased by 7.7 percentage points over the last five years. This raises questions about the company’s expense base because its revenue growth should have given it leverage on its fixed costs, resulting in better economies of scale and profitability.
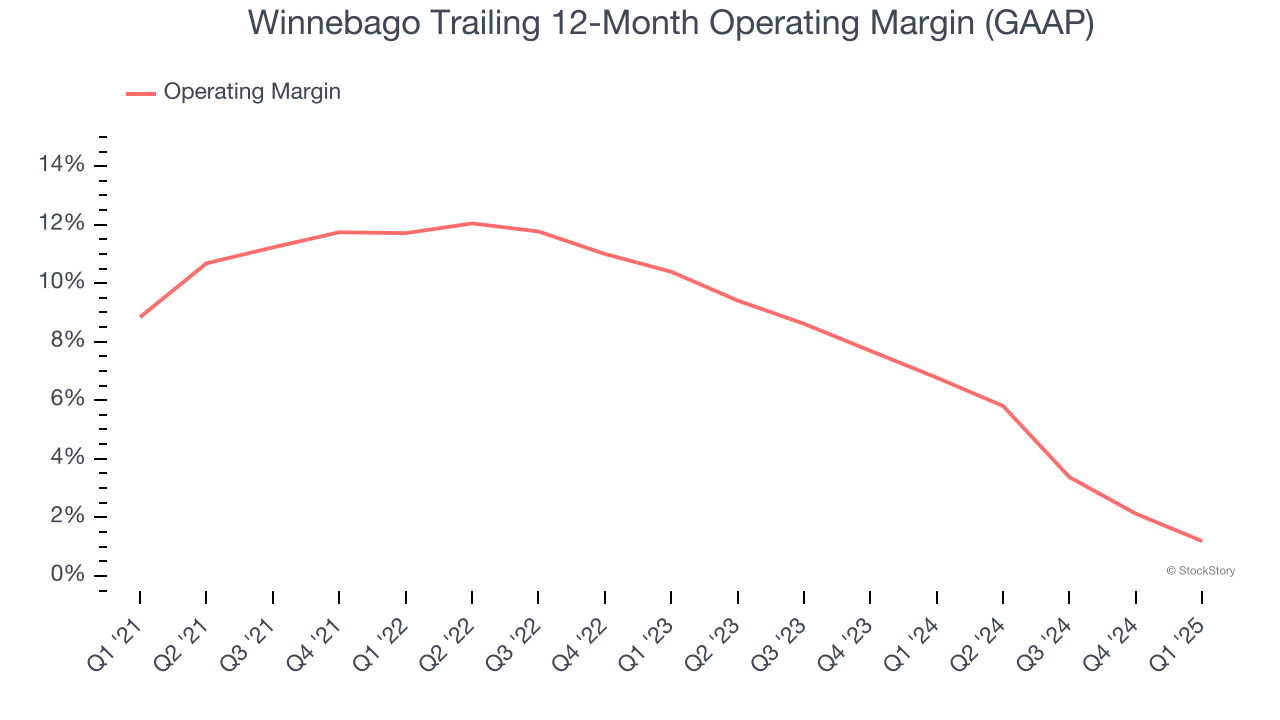
In Q1, Winnebago generated an operating profit margin of 1.3%, down 3.8 percentage points year on year. Since Winnebago’s operating margin decreased more than its gross margin, we can assume it was less efficient because expenses such as marketing, R&D, and administrative overhead increased.
Earnings Per Share
We track the long-term change in earnings per share (EPS) for the same reason as long-term revenue growth. Compared to revenue, however, EPS highlights whether a company’s growth is profitable.
Sadly for Winnebago, its EPS declined by 15.2% annually over the last five years while its revenue grew by 3.9%. This tells us the company became less profitable on a per-share basis as it expanded due to non-fundamental factors such as interest expenses and taxes.
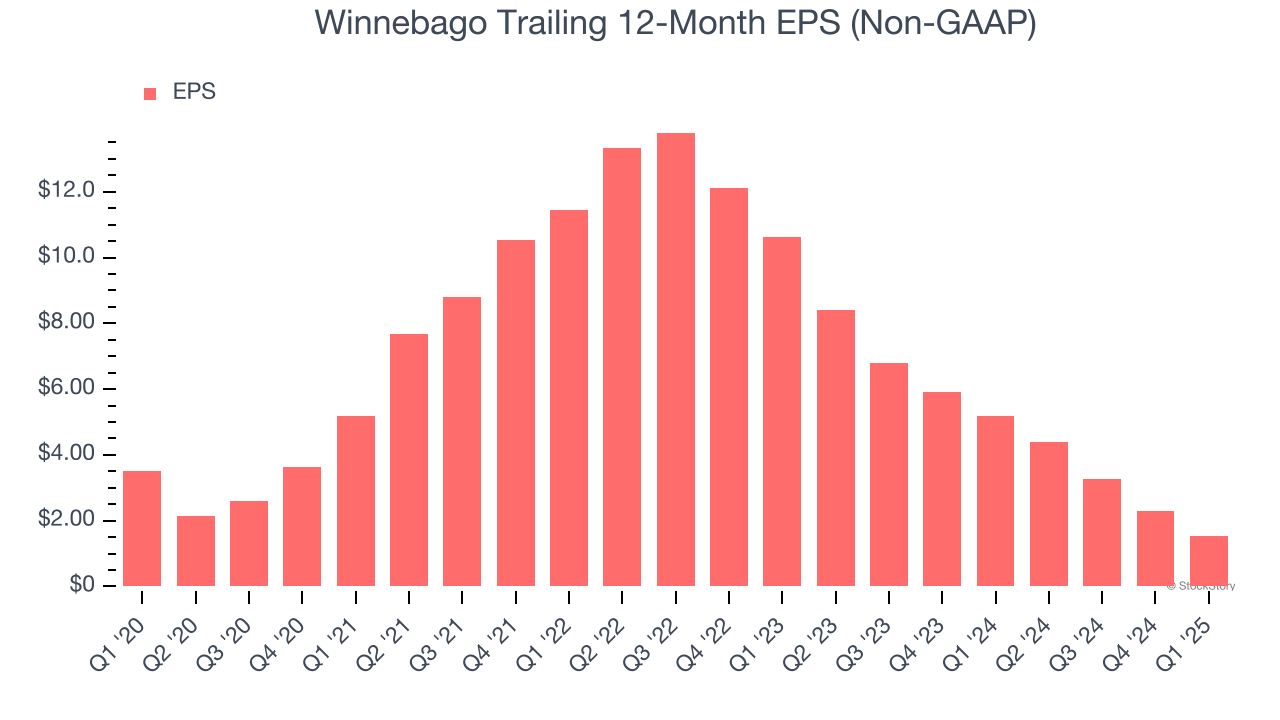
Diving into the nuances of Winnebago’s earnings can give us a better understanding of its performance. As we mentioned earlier, Winnebago’s operating margin declined by 7.7 percentage points over the last five years. This was the most relevant factor (aside from the revenue impact) behind its lower earnings; taxes and interest expenses can also affect EPS but don’t tell us as much about a company’s fundamentals.
Like with revenue, we analyze EPS over a shorter period to see if we are missing a change in the business.
For Winnebago, its two-year annual EPS declines of 61.9% show it’s continued to underperform. These results were bad no matter how you slice the data.
In Q1, Winnebago reported EPS at $0.19, down from $0.93 in the same quarter last year. Despite falling year on year, this print easily cleared analysts’ estimates. Over the next 12 months, Wall Street expects Winnebago’s full-year EPS of $1.54 to grow 184%.
Key Takeaways from Winnebago’s Q1 Results
We enjoyed seeing Winnebago beat analysts’ EPS expectations this quarter. We were also glad its full-year EPS guidance exceeded Wall Street’s estimates. On the other hand, its full-year revenue guidance was lowered and missed. Overall, this quarter had some key positives. The stock traded up 3.5% to $35.99 immediately after reporting.
Is Winnebago an attractive investment opportunity at the current price? If you’re making that decision, you should consider the bigger picture of valuation, business qualities, as well as the latest earnings. We cover that in our actionable full research report which you can read here, it’s free.
