Which Way Wednesday – GDP Edition

GDP at 8:30 . The expert panel of leading Economorons believes that the 3rd Revision to Q4 will show we had 7% growth – the same as it was last time but I think a bit will be shaved off as the later Decemeber data had a bit more Covid in it (hard to remember with all the crap that's happened since, isn't it?).   More to the point, the Atlanta Fed says GDP growth has dropped to 1% in Q1 (Economorons say 3%) so we KNOW GDP is heading lower – it's just a question of when it starts to do so.  What will the market's reaction be?  We'll find out after the 8:30 data.  Oil prices averaged $75 in Oct, Nov and December last year and we've been over $100 all of March and over $80 since the year began but is that good for GDP (we produce a lot of oil) or bad for it (we use a lot of oil)?   Last night's API Report showed a 3Mb draw in Oil, -1.5Mb of Gasoline and -200,000 barrels of Distillates and that's popped us back from $103 yesterday to $107 this morning but now that the draw is baked in, I like Oil ( /CL ) Futures short at $107 with tight stops above as we can easiliy drop back to $105, which would be a gain of $2,000 per contract.   Our indexes have gained so much for the month that we are back to using our Retracement Chart (from the All-Time Highs) as opposed to our Bounce Chart (from 20% corrections), so that's progress – kind of.  Unfortunately, the Retracement Chart still has a lot of red – which means those 20% drops are still in pay. Dow  36,000 to 34,200 has bounce lines of  34,560  (weak) and  34,920  (strong)  S&P 4,700 to 4,465 has bounce lines of  4,512  (weak) and  4,559  (strong)  Nasdaq 16,500 to 15,675 has bounce lines of  15,840  (weak) and  16,005  (strong)  Russell 2,400 to 2,080 has bounce lines of  2,144  (weak) and  2,208  (strong)       The Russell is on the cusp so it needs to show us something this week and the Nasdaq is our lagging index otherwise – not …

GDP at 8:30.

The expert panel of leading Economorons believes that the 3rd Revision to Q4 will show we had 7% growth – the same as it was last time but I think a bit will be shaved off as the later Decemeber data had a bit more Covid in it (hard to remember with all the crap that's happened since, isn't it?).  

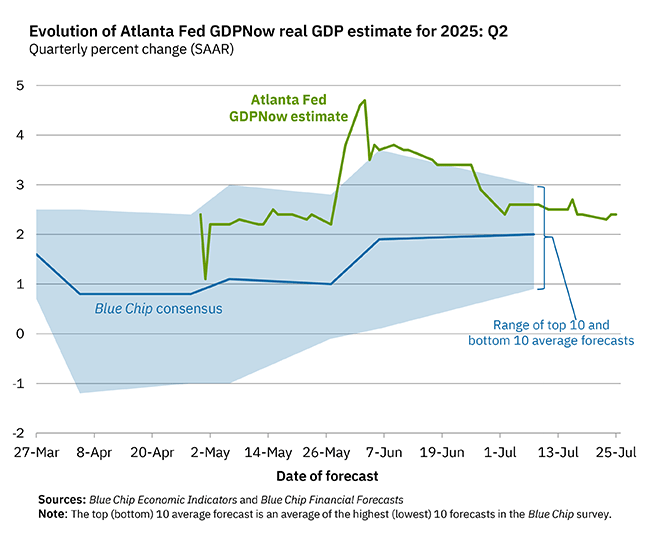
More to the point, the Atlanta Fed says GDP growth has dropped to 1% in Q1 (Economorons say 3%) so we KNOW GDP is heading lower – it's just a question of when it starts to do so.  What will the market's reaction be?  We'll find out after the 8:30 data.  Oil prices averaged $75 in Oct, Nov and December last year and we've been over $100 all of March and over $80 since the year began but is that good for GDP (we produce a lot of oil) or bad for it (we use a lot of oil)?  

Last night's API Report showed a 3Mb draw in Oil, -1.5Mb of Gasoline and -200,000 barrels of Distillates and that's popped us back from $103 yesterday to $107 this morning but now that the draw is baked in, I like Oil (/CL) Futures short at $107 with tight stops above as we can easiliy drop back to $105, which would be a gain of $2,000 per contract.  

Our indexes have gained so much for the month that we are back to using our Retracement Chart (from the All-Time Highs) as opposed to our Bounce Chart (from 20% corrections), so that's progress – kind of.  Unfortunately, the Retracement Chart still has a lot of red – which means those 20% drops are still in pay.

  • Dow  36,000 to 34,200 has bounce lines of 34,560 (weak) and 34,920 (strong) 
  • S&P 4,700 to 4,465 has bounce lines of 4,512 (weak) and 4,559 (strong) 
  • Nasdaq 16,500 to 15,675 has bounce lines of 15,840 (weak) and 16,005 (strong) 
  • Russell 2,400 to 2,080 has bounce lines of 2,144 (weak) and 2,208 (strong)
   

The Russell is on the cusp so it needs to show us something this week and the Nasdaq is our lagging index otherwise – not
continue reading

Stock Quote API & Stock News API supplied by www.cloudquote.io
Quotes delayed at least 20 minutes.
By accessing this page, you agree to the following
Privacy Policy and Terms and Conditions.