

Building materials distributor GMS (NYSE: GMS) fell short of the market’s revenue expectations in Q4 CY2024, with sales flat year on year at $1.26 billion. Its non-GAAP profit of $0.92 per share was 34.1% below analysts’ consensus estimates.
Is now the time to buy GMS? Find out by accessing our full research report, it’s free.
GMS (GMS) Q4 CY2024 Highlights:
- Revenue: $1.26 billion vs analyst estimates of $1.29 billion (flat year on year, 2.5% miss)
- Adjusted EPS: $0.92 vs analyst expectations of $1.40 (34.1% miss)
- Adjusted EBITDA: $93.04 million vs analyst estimates of $115.2 million (7.4% margin, 19.2% miss)
- Operating Margin: 0.4%, down from 6.9% in the same quarter last year
- Free Cash Flow Margin: 6.6%, similar to the same quarter last year
- Organic Revenue fell 6.7% year on year (-0.6% in the same quarter last year)
- Market Capitalization: $3.06 billion
Company Overview
Founded in 1971, GMS (NYSE: GMS) distributes specialty building materials including wallboard, ceilings, and insulation products, to the construction industry.
Building Material Distributors
Supply chain and inventory management are themes that grew in focus after COVID wreaked havoc on the global movement of raw materials and components. Building materials distributors that boast reliable selection and quickly deliver products to customers can benefit from this theme. While e-commerce hasn’t disrupted industrial distribution as much as consumer retail, it is forcing investment in digital capabilities to communicate with and serve customers everywhere. Additionally, building materials distributors are at the whim of economic cycles that impact the capital spending and construction projects that can juice demand.
Sales Growth
Examining a company’s long-term performance can provide clues about its quality. Any business can put up a good quarter or two, but many enduring ones grow for years. Luckily, GMS’s sales grew at an impressive 11.5% compounded annual growth rate over the last five years. Its growth beat the average industrials company and shows its offerings resonate with customers.
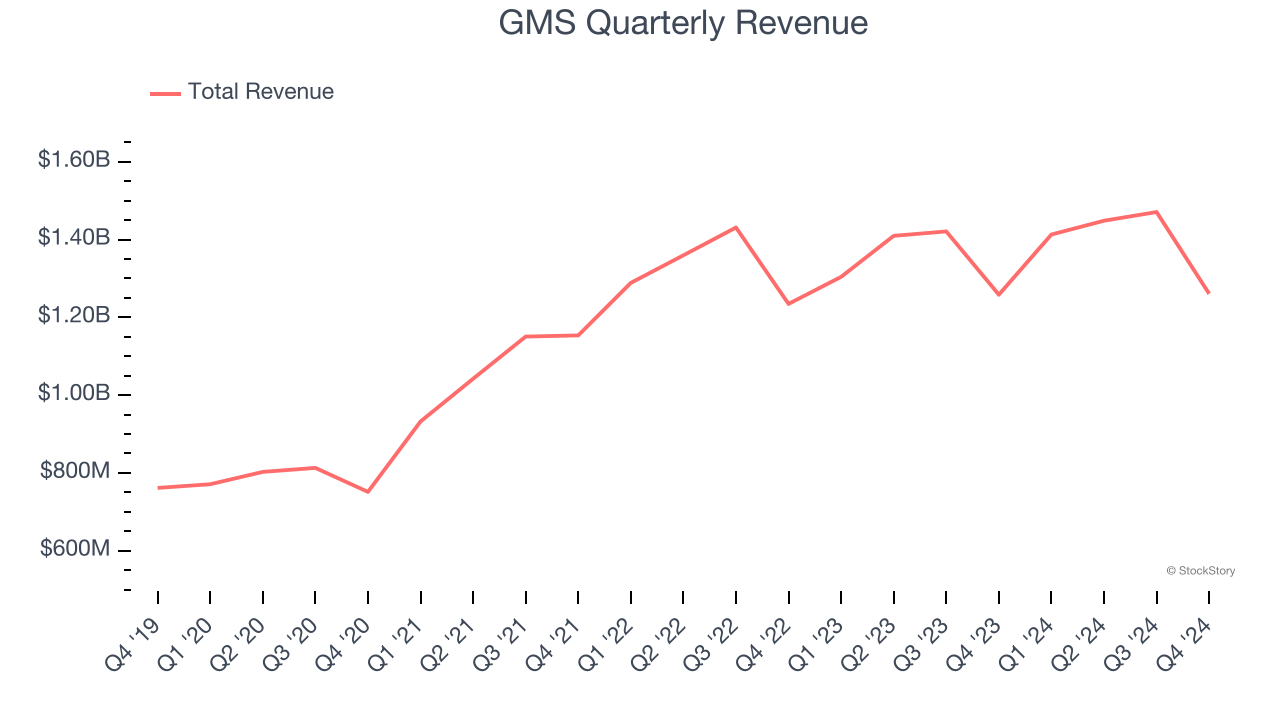
We at StockStory place the most emphasis on long-term growth, but within industrials, a half-decade historical view may miss cycles, industry trends, or a company capitalizing on catalysts such as a new contract win or a successful product line. GMS’s recent history shows its demand has slowed significantly as its annualized revenue growth of 2.6% over the last two years was well below its five-year trend. 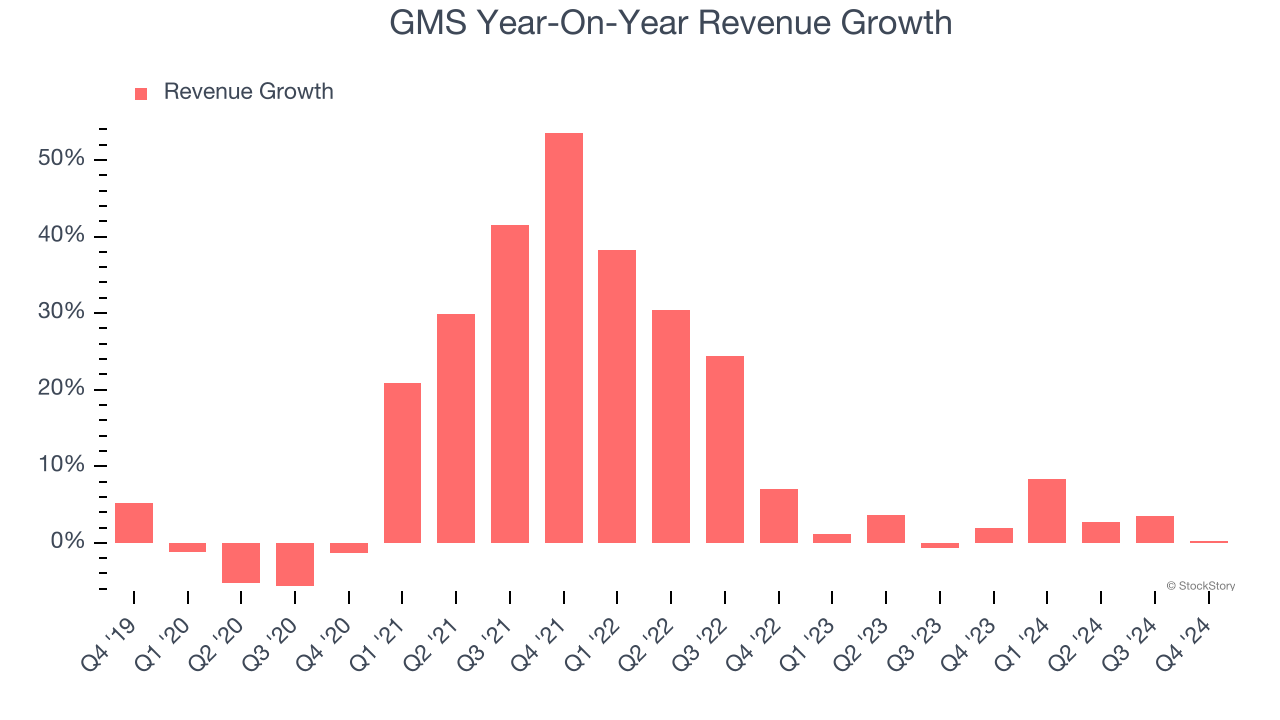
We can dig further into the company’s sales dynamics by analyzing its organic revenue, which strips out one-time events like acquisitions and currency fluctuations that don’t accurately reflect its fundamentals. Over the last two years, GMS’s organic revenue averaged 1.3% year-on-year declines. Because this number is lower than its normal revenue growth, we can see that some mixture of acquisitions and foreign exchange rates boosted its headline results. 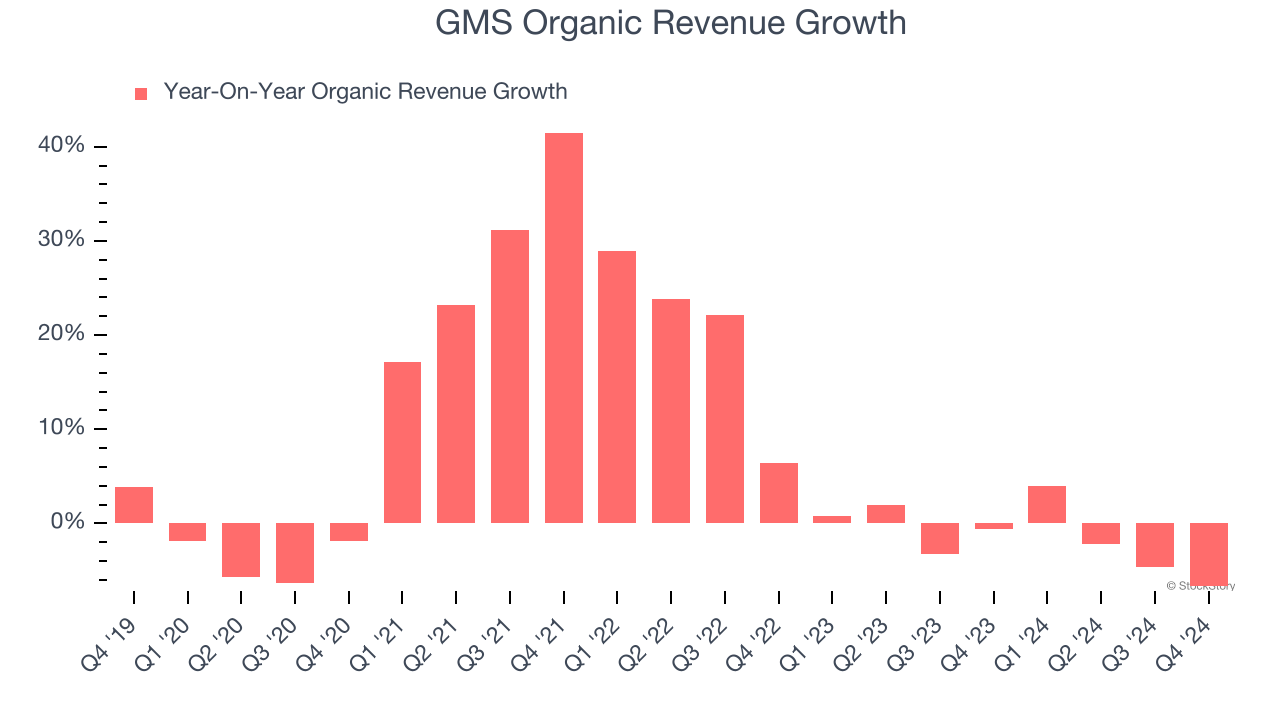
This quarter, GMS’s $1.26 billion of revenue was flat year on year, falling short of Wall Street’s estimates.
Looking ahead, sell-side analysts expect revenue to grow 2.4% over the next 12 months, similar to its two-year rate. This projection is underwhelming and implies its newer products and services will not accelerate its top-line performance yet.
Unless you’ve been living under a rock, it should be obvious by now that generative AI is going to have a huge impact on how large corporations do business. While Nvidia and AMD are trading close to all-time highs, we prefer a lesser-known (but still profitable) stock benefiting from the rise of AI. Click here to access our free report one of our favorites growth stories.
Operating Margin
Operating margin is one of the best measures of profitability because it tells us how much money a company takes home after procuring and manufacturing its products, marketing and selling those products, and most importantly, keeping them relevant through research and development.
GMS was profitable over the last five years but held back by its large cost base. Its average operating margin of 7.3% was weak for an industrials business.
On the plus side, GMS’s operating margin rose by 2.2 percentage points over the last five years, as its sales growth gave it operating leverage.
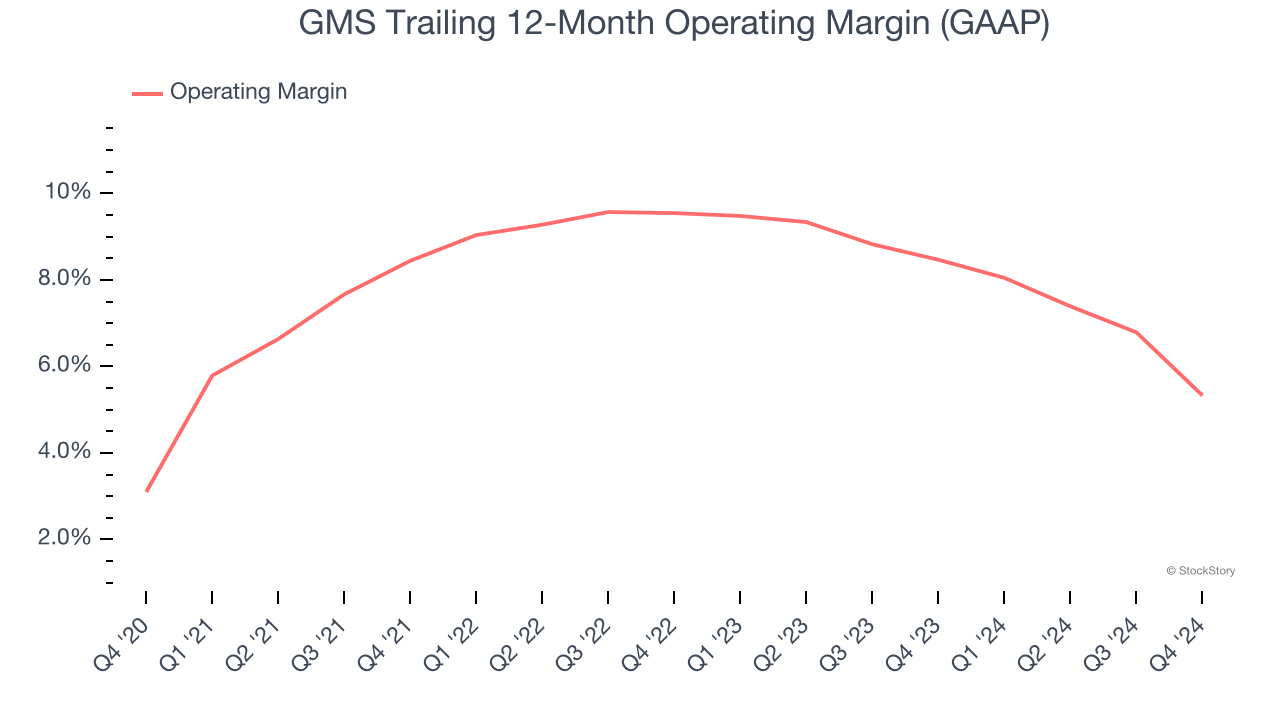
This quarter, GMS’s breakeven margin was down 6.5 percentage points year on year. Since GMS’s operating margin decreased more than its gross margin, we can assume it was recently less efficient because expenses such as marketing, R&D, and administrative overhead increased.
Earnings Per Share
Revenue trends explain a company’s historical growth, but the long-term change in earnings per share (EPS) points to the profitability of that growth – for example, a company could inflate its sales through excessive spending on advertising and promotions.
GMS’s EPS grew at a spectacular 17.4% compounded annual growth rate over the last five years, higher than its 11.5% annualized revenue growth. This tells us the company became more profitable on a per-share basis as it expanded.
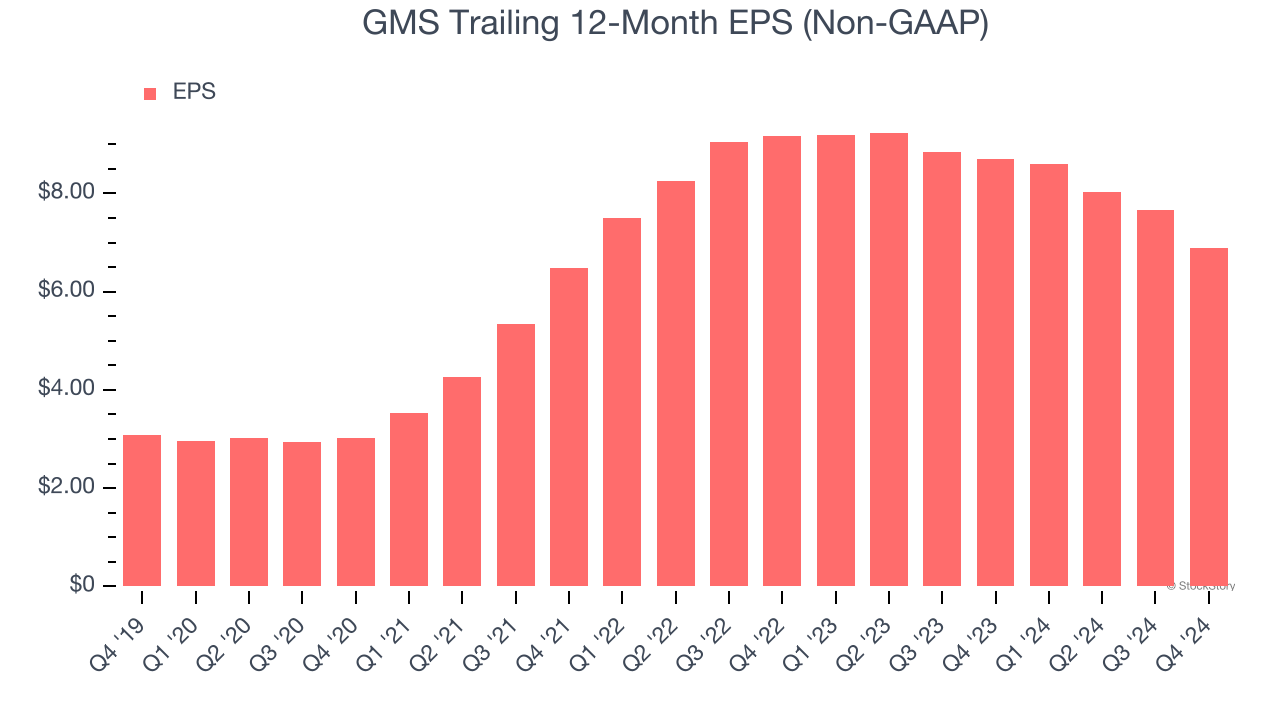
Diving into GMS’s quality of earnings can give us a better understanding of its performance. As we mentioned earlier, GMS’s operating margin declined this quarter but expanded by 2.2 percentage points over the last five years. Its share count also shrank by 9.9%, and these factors together are positive signs for shareholders because improving profitability and share buybacks turbocharge EPS growth relative to revenue growth. 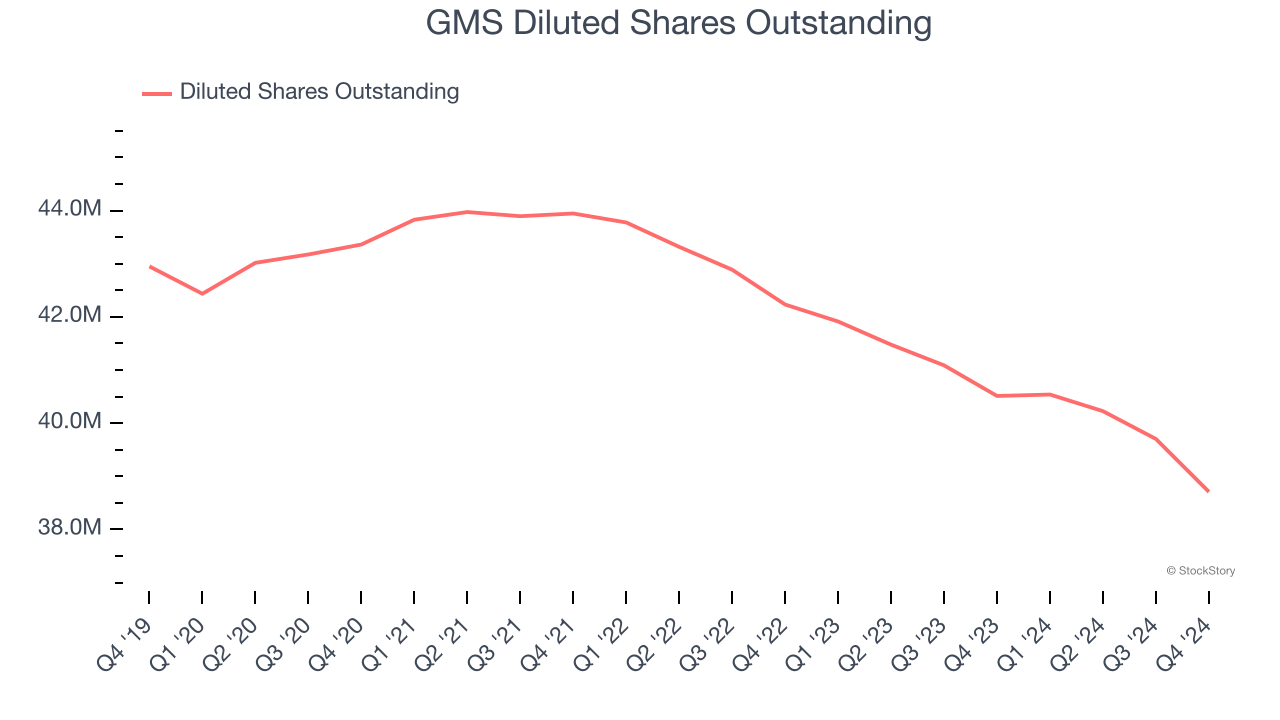
Like with revenue, we analyze EPS over a more recent period because it can provide insight into an emerging theme or development for the business.
For GMS, its two-year annual EPS declines of 13.3% mark a reversal from its (seemingly) healthy five-year trend. We hope GMS can return to earnings growth in the future.
In Q4, GMS reported EPS at $0.92, down from $1.70 in the same quarter last year. This print missed analysts’ estimates, but we care more about long-term EPS growth than short-term movements. Over the next 12 months, Wall Street expects GMS’s full-year EPS of $6.88 to grow 13.7%.
Key Takeaways from GMS’s Q4 Results
We were impressed by how significantly GMS blew past analysts’ organic revenue expectations this quarter. On the other hand, its revenue missed significantly and its EBITDA fell short of Wall Street’s estimates. Overall, this quarter could have been better. The stock traded down 4.9% to $74.88 immediately after reporting.
GMS’s latest earnings report disappointed. One quarter doesn’t define a company’s quality, so let’s explore whether the stock is a buy at the current price. When making that decision, it’s important to consider its valuation, business qualities, as well as what has happened in the latest quarter. We cover that in our actionable full research report which you can read here, it’s free.
