- Online prices increased 3.5% year-over-year
- November marked 18th consecutive month of online inflation
- One dollar out of every four dollars now spent online in the U.S.
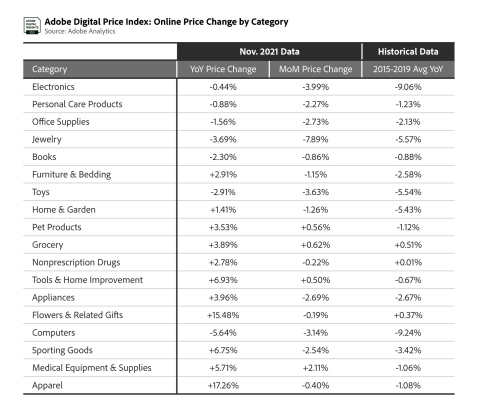
Adobe (Nasdaq:ADBE) today announced the latest online inflation data for the month of November 2021. Online prices hit a record high at a 3.5% year-over-year (YoY) increase while prices are down 2% month-over-month (MoM) due to holiday discounts. This is the highest YoY increase since Adobe first began tracking the digital economy in 2014, and it marks the 18th consecutive month of YoY online inflation. Apparel was a standout category with prices up 17.3% YoY and down just 0.4% MoM, reaching a record high of inflation. One dollar out of every four dollars* is now spent online in the U.S., making the digital economy a significant component of the overall economy.
This press release features multimedia. View the full release here: https://www.businesswire.com/news/home/20211209005245/en/

(Graphic: Business Wire)
The Adobe Digital Price Index (DPI) provides the most comprehensive view into how much consumers are paying for goods online. The DPI covers more than 100 million products in the U.S. and is modeled after the Consumer Price Index issued by the U.S. Bureau of Labor Statistics. The DPI is updated monthly and covers 18 product categories: electronics, apparel, appliances, books, toys, computers, groceries, furniture/bedding, tools/home improvement, home/garden, pet products, jewelry, medical equipment/supplies, sporting goods, personal care products, flowers/related gifts, nonprescription drugs and office supplies.
“Census Bureau data shows that the e-commerce share of non-fuel retail spending has tripled over the last decade as more expenditures like groceries and home improvement move online,” said economist Marshall Reinsdorf, former senior economist at International Monetary Fund. "Measures of digital economy prices have a growing role to play in how we understand inflation, and the Adobe Digital Price Index provides a timely pulse on this important part of the cost-of-living picture that complements indicators like the Consumer Price Index.”
“Ongoing supply chain constraints and durable consumer demand have underpinned the record high inflation in e-commerce, with apparel seeing high volumes of out-of-stock messages online compared to other categories,” said Patrick Brown, vice president of growth marketing and insights, Adobe. “With offline prices surging in the Consumer Price Index, however, it is still cheaper to shop online for categories such as toys, computers and sporting goods.”
Notable Categories in the Adobe Digital Price Index (November 2021)
In November 2021, 11 of the 18 categories tracked by the Adobe Digital Price Index saw YoY price increases. Apparel prices rose faster than any other category, while price drops were observed in seven categories: electronics, personal care products, office supplies, jewelry, books, toys and computers. On a MoM basis, all but four categories (groceries, pet products, tools/home improvement and medical equipment/supplies) saw prices decrease as holiday discounts kicked in.
- Apparel: Prices are up 17.3% YoY and down 0.4% MoM. Since 2014, only three months (August 2016, January 2020, February 2020) saw apparel prices rise online by 9% or more YoY. For the past eight consecutive months, online prices for the category have risen by over 9% YoY every month.
- Groceries: Prices are up 3.9% YoY and up 0.6% MoM. Online prices have risen on an annual basis for 22 months, moving in lock step with the Consumer Price Index, which captures prices that consumers are paying for groceries in physical stores.
- Electronics: Prices are down 0.4% YoY and down 4.0% MoM. Historically (2015–2019), prices were down 9.06% YoY on average for the category, which includes gaming consoles, mobile devices, televisions and wearables. On Cyber Monday 2021, consumers paid more for electronics compared to years past, with price drops in the 12% range versus 27% range.
- Appliances: Prices are up 4% YoY and down 2.7% MoM. The category has seen 19 consecutive months of online inflation on an annual basis. After hitting a low point in December 2019 (prices down 4.6% YoY), prices began rising by May 2020 (up 0.2% YoY) and hit its peak in December 2020 (up 7.1% YoY).
- Toys: Prices are down 2.9% YoY and down 3.6% MoM. It is one of few categories where pricing trends follow a historical pattern of persistent, stronger deflation. (Books and computers follow a similar trend). On Cyber Monday 2021, toys was the only category where price drops were greater than last season, in the 22% range versus 19% range.
Methodology
The DPI is modeled after the Consumer Price Index, published by the U.S. Bureau of Labor Statistics, and uses the Fisher Price Index to track online prices. The Fisher Ideal Price Index uses quantities of matched products purchased in the current period (month) and a previous period (previous month) to calculate the price changes by category. Adobe’s analysis is weighted by the real quantities of the products purchased in the two adjacent months.
Powered by Adobe Analytics, the DPI analyzes 1 trillion visits to retail sites and over 100 million SKUs in 18 product categories. Adobe uses a combination of Adobe Sensei, Adobe’s AI and machine learning framework, and manual effort to segment the products into the categories defined by the CPI manual. The methodology was first developed alongside renowned economists Austan Goolsbee and Pete Klenow.
* Adobe expects $1 in $4 will be spent online during the 2021 holiday shopping season (Nov. 1 to Dec. 31), indexed to the National Retail Federation’s (NRF) total retail forecast that includes in-store sales.
About Adobe
Adobe is changing the world through digital experiences. For more information, visit www.adobe.com.
© 2021 Adobe. All rights reserved. Adobe and the Adobe logo are either registered trademarks or trademarks of Adobe in the United States and/or other countries. All other trademarks are the property of their respective owners.
View source version on businesswire.com: https://www.businesswire.com/news/home/20211209005245/en/
Contacts
Kevin Fu
Adobe
kfu@adobe.com
Bassil Elkadi
Adobe
belkadi@adobe.com

